My product
LoanLens
A leak-free default-risk scorecard and approval-policy simulator for lenders, built on public Prosper loan data and tested on future loans.
What it is
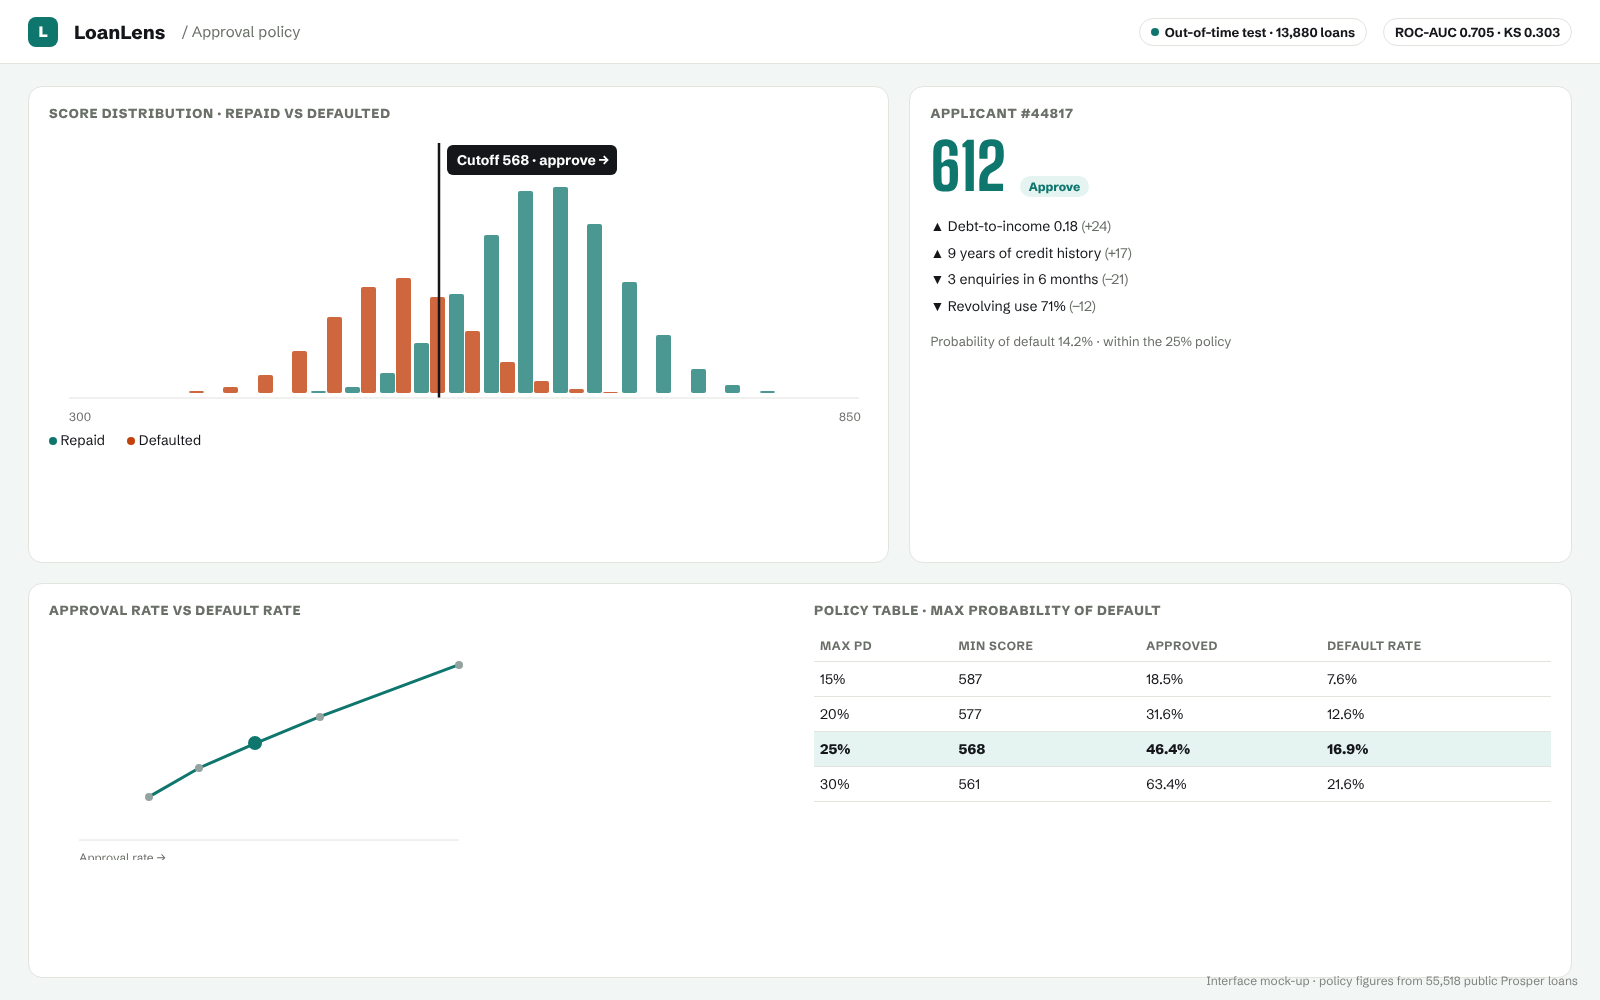
LoanLens gives a loan application a probability of default and a 300–850 score, with reasons, and lets a lender see how an approval cutoff changes approvals, defaults and expected yield.
The problem
Many public notebooks on the Prosper loan data report very high accuracy because they use columns that only exist after a loan is made, such as payments and delinquency. They also split the data at random, which mixes very different years. A credit committee needs an honest probability, a readable scorecard and a way to test a policy.
What I built
- A model that uses only information known when the application is made.
- A WoE scorecard as a transparent baseline, and a calibrated gradient-boosting model that beats it.
- A policy simulator that shows approvals, observed default rate and expected yield at each cutoff.
How it’s checked
The split is by time. The model learns from loans made between November 2005 and September 2011 and is tested on loans made from September 2011 to February 2014, which it has never seen.
What the results do and don’t tell you
On the public Prosper dataset (55,518 closed loans, of which 13,880 are in the test period):
- Test ROC-AUC 0.705 (95% interval 0.694 to 0.714) and KS 0.303, against 0.667 for the scorecard baseline.
- With a 25% maximum predicted default probability, about 46% of test loans are approved and the observed default rate among them is 16.9%, against 30.7% across all test loans.
A ROC-AUC of 0.705 is modest. It means the model ranks risk usefully, not that it predicts individual outcomes well. The data is American peer-to-peer lending from 2005 to 2014, so none of this transfers to Nigerian lending without new data and checks.
My role
I did all of it: data preparation, modelling, calibration, the policy simulator and the app.
Stack
Python, scikit-learn, gradient boosting, Streamlit.
Where these facts come from
/home/user/ai-ml-data-engineering/products/loanlens/README.md/home/user/ai-ml-data-engineering/machine-learning/prosper-loan-risk/reports/metrics.json