Why my fraud model reports PR-AUC, not accuracy
Update, 1 November 2026: an audit found two flaws in the run this post describes: the calibration step was fitted on the model’s own training predictions, and one feature was built from the labels. After fixing both, Moniguard scores PR-AUC 0.959 in batch evaluation and 0.837 when each transaction is scored on its own through the API (synthetic data). The figures below are the ones from 29 October; the case study has the current numbers.
Moniguard, my fraud-scoring project, does not lead with accuracy. For this kind of problem accuracy can look excellent while meaning almost nothing, and the reason is worth a short post.
The 97% model that catches nothing
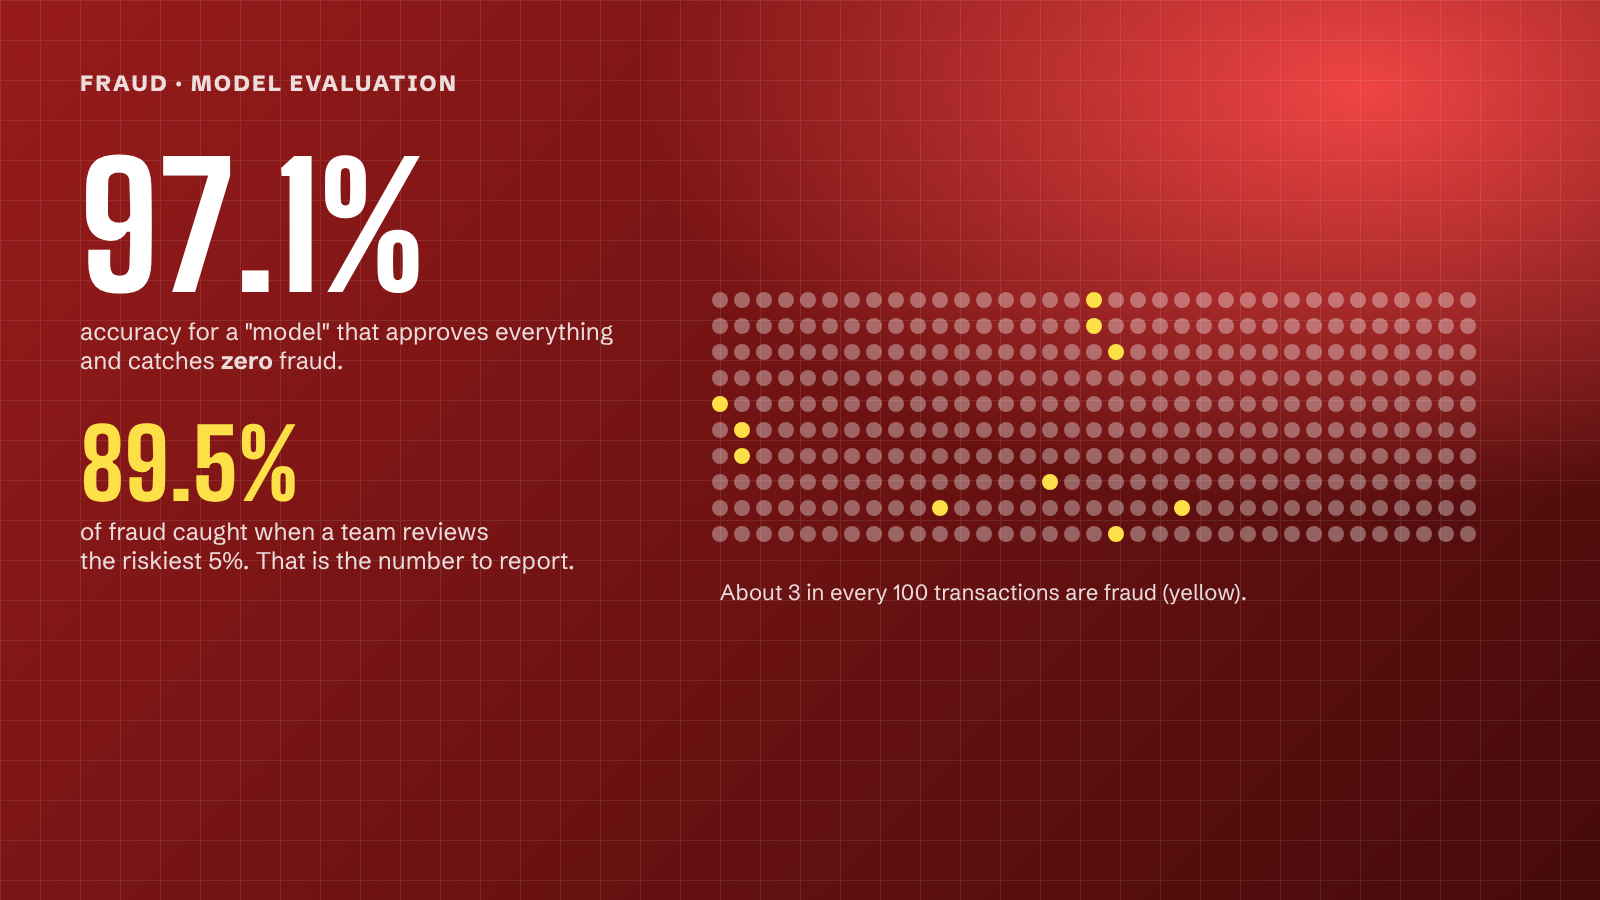
In my test data, about 2.9% of transactions are fraud. Imagine a “model” that approves everything. It is right on every legitimate transaction, so it scores about 97.1% accuracy. It also catches zero fraud.
That is the trap with imbalanced problems. Fraud, churn and loan default all have a small positive class, and accuracy mostly measures how well you predict the large class. A high accuracy number tells you very little here, so I do not lead with it.
What I report instead
PR-AUC. The precision-recall curve shows, across all possible thresholds, how many of the transactions you flag are really fraud (precision) against how much of the fraud you catch (recall). Its area, PR-AUC, is a better summary when positives are rare, because a model that flags everything or nothing scores badly on it. On the held-out test set, Moniguard’s PR-AUC is 0.875, with a 95% bootstrap interval of 0.841 to 0.898. I give the interval because a single number hides how much it could move with a different sample.
Recall at a fixed alert budget. A fraud team cannot review everything. The question they actually ask is: if we can review the riskiest 1% or 5% of transactions, how much fraud do we catch? For Moniguard the answer is a recall of 0.341 at a 1% review rate and 0.895 at 5%. In plain terms, with a 5% review budget, about 89 of every 100 fraud cases land in front of a person. At 1% it is about 34. Those two numbers tell a manager how many analysts they would need.
I also report ROC-AUC (0.945), but it is the least useful of the three here. With so few positives, ROC-AUC can look excellent while the model still produces many false alarms.
Split by time, not at random
The second decision matters as much as the metric. I did not shuffle the data. The model trains on the earliest 70% of a 180-day period (42,000 transactions) and is tested on the latest 30% (18,000), which it has never seen. In real life you train on the past and score the future, and fraudsters change tactics. A random split lets the model peek at the same days it is tested on and makes the results look better than they would be in use.
The honest part
All of these numbers come from synthetic data. I generated 60,000 Nigerian pay-on-delivery transactions with six fraud patterns that I wrote into the generator myself: card fraud, account takeover, refund abuse, identity theft, triangulation and friendly fraud. So the score shows how well the ensemble separates those six patterns from normal transactions. It does not show how well it would catch fraud patterns the generator never produced, and it is not a result on a public benchmark like PaySim or IEEE-CIS. I have not run it on one yet, and I list that as the most important gap in the project’s README.
That is why the metrics file in the repo carries its own warning that the numbers “do not represent performance on real transaction data”. I would rather you hear that from me than discover it later.
What I would do before trusting it
- Run the same evaluation on a public fraud benchmark, then on a merchant’s own data in a small pilot.
- Pick the alert budget with the people who will review the alerts, then set the threshold from that budget, not from a metric.
- Watch for drift once it is live, because the score is only as good as the match between the training data and today’s transactions.
If you are choosing a fraud or churn model for your business, ask the vendor or the analyst three questions: what is the positive rate, how was the data split, and what does it catch at the review volume we can afford. An accuracy number alone will not answer any of them.
The code and the metrics file are in the project’s public repository on my GitHub profile.