A credit-score cutoff is a business decision, not a model output
LoanLens, my credit-risk project, scores consumer loan applications from 300 to 850. People usually ask me one question about it: “So what score should we approve?” The model cannot answer that by itself. It ranks borrowers from safer to riskier; where you draw the line depends on how much risk the lender wants to carry. This post shows how I turn that line into a choice a credit committee can actually make.
The data, and why the honest number is 0.70
LoanLens uses the public Prosper peer-to-peer lending dataset. I kept only loans whose outcome is known (completed, defaulted, charged off or more than 60 days past due), which leaves 55,518 loans. Loans still running are left out, because counting a 2013 loan with two years left to pay as “good” would make recent cohorts look safer than they are.
Then I split by time. The model learns from 41,638 loans made between November 2005 and September 2011 and is tested on the 13,880 loans made after that, up to February 2014. That is how a lender uses a model: trained on the past, used on the next applicants.
On that later period the model reaches a ROC-AUC of 0.705 (95% interval 0.695 to 0.714) and a KS of 0.303. Plenty of public notebooks on this dataset report 0.95 or more. The usual reason is that they include columns that only exist after the loan is made, such as payments received or days delinquent. Those columns contain the answer. A test in the project fails the build if any of the 14 post-origination fields reaches the features, so 0.70 is the number you would actually get on new applications.
From scores to a policy table
Instead of picking one threshold, I simulate the whole range on the 13,880 test loans. For each maximum probability of default the lender is willing to accept, the table shows who gets approved and what happens to them:
| Max probability of default | Minimum score | Approval rate | Default rate of approved loans | Net expected yield |
|---|---|---|---|---|
| 15% | 587 | 18.5% | 7.6% | +7.4% |
| 20% | 577 | 31.6% | 12.6% | +6.9% |
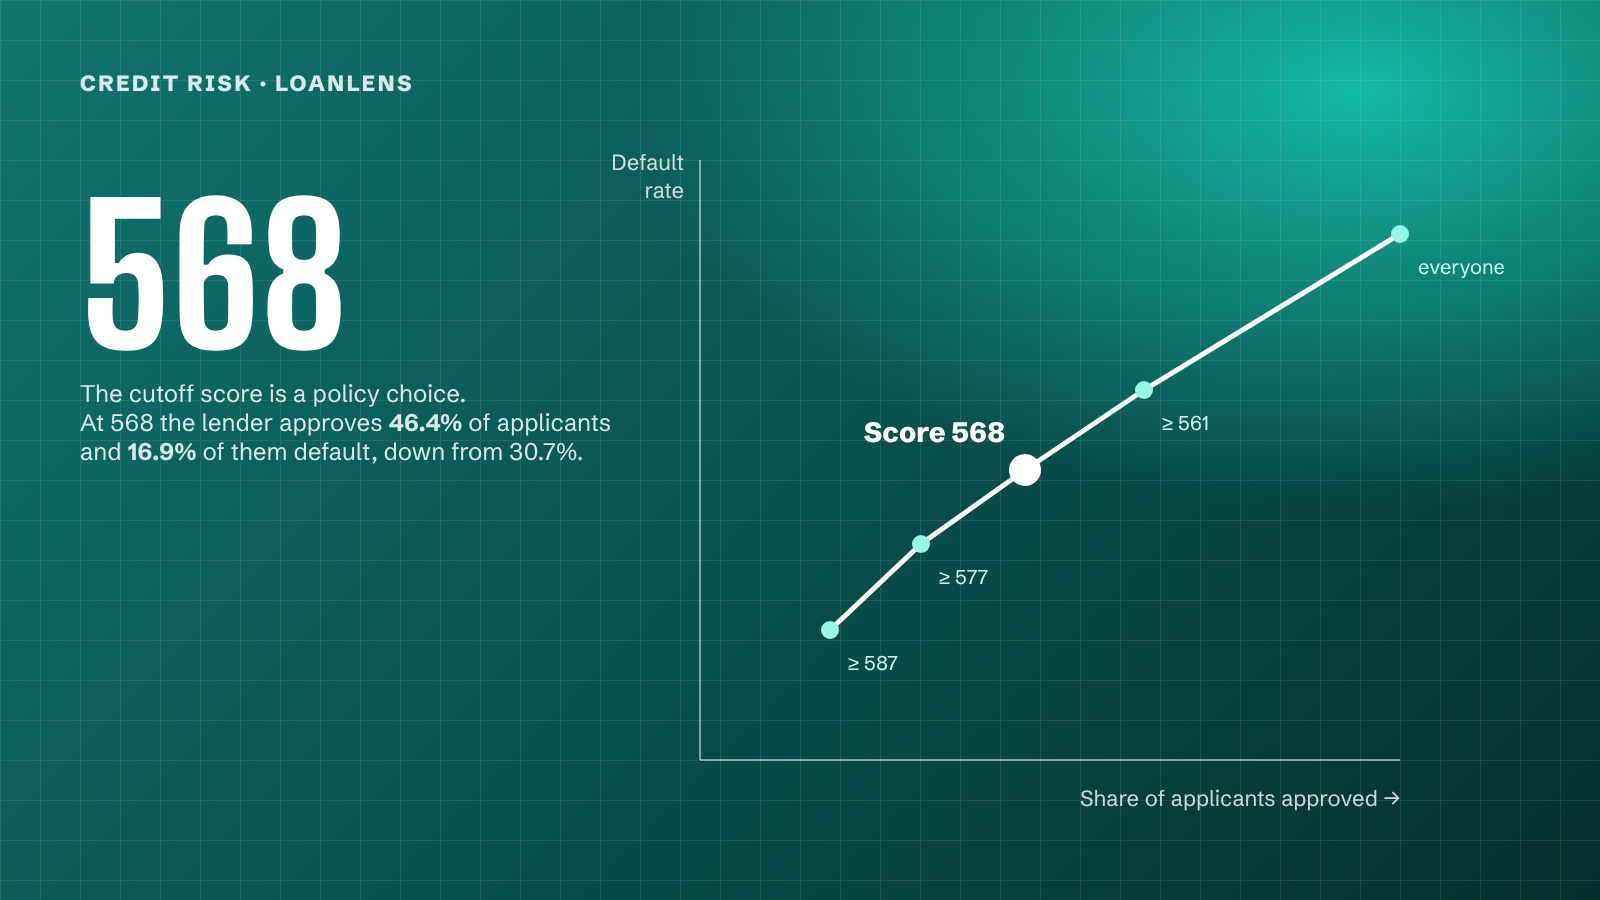
| 25% | 568 | 46.4% | 16.9% | +6.6% |
| 30% | 561 | 63.4% | 21.6% | +5.6% |
| Approve everyone | 300 | 100% | 30.7% | +2.2% |
Net expected yield is the average borrower rate minus expected loss, with expected loss taken as the default rate times a 65% loss given default. It is a simple model of profit, not a full one: it ignores funding cost, servicing cost and the time value of money.
Approving everyone means nearly one loan in three defaults. At a 25% cutoff (a minimum score of 568) the lender approves 46.4% of applicants, the approved loans default at 16.9%, and the yield after losses roughly triples from +2.2% to +6.6%. A tighter cutoff earns a little more per loan but turns away most applicants; a looser one grows the book and lowers the margin. The right row depends on the lender’s appetite for growth and loss, which is why I present a table and not a single “best” threshold.
Checking who the cutoff turns away
Before recommending a cutoff, I check whether it treats groups very differently. The model is not trained on protected attributes, but other features can act as stand-ins for them. The dataset has few demographic fields, so the check I could run is homeowners against non-homeowners at the 25% cutoff: 47.3% against 45.5% approved, a gap of 1.8 percentage points, while their actual default rates were 28.5% and 32.9%. The gap follows a real difference in risk rather than creating one. It is one slice, not a full fairness audit, and a lender would need to test the attributes its regulator cares about.
What this does not tell a Nigerian lender
These are US loans from 2005 to 2014. A Nigerian microfinance bank or digital lender would need to retrain and recalibrate on local bureau data (CRC, FirstCentral) and on bank-statement cash flow, which matters more for borrowers with thin credit files. The method carries over: split by time, keep post-loan data out, and choose the cutoff from a policy table with the people who own the losses. The model weights do not carry over.
The code, the tests and the full policy curve are in the LoanLens folder of my public ai-ml-data-engineering repository on GitHub.