Can $100 become $4,000 in a month of trading? I simulated it 2,500 times
“Turn $100 into $4,000 this month” is a common goal in trading groups. Lolo’s Ledger, the trading journal I am building, has a feature for exactly this moment. Before a trader starts, they enter their balance, their target and how many trading days they have, and the journal runs the numbers. This post explains what it does and what it says about that goal.
Step one: the required daily return
The first check needs no simulation. Going from $100 to $4,000 in 20 trading days means multiplying the account by 40. Spread evenly, that is a gain of 20.25% every single day, compounded, with no losing days. For comparison, a trader who risks 1% of the account per trade and makes two trades a day can gain at most a few percent on a very good day.
Compare a disciplined goal: $10,000 to $11,500 in 60 trading days. That needs 0.23% a day, which is within reach of a trader with a real edge and careful risk.
Step two: 2,500 possible futures
A required return is easy to argue with (“I’ll just have a few big days”), so the journal also simulates. It plays out 2,500 possible sequences of trades, each one a random run of wins and losses drawn from the trader’s own statistics. For the example here: a 55% win rate, wins of 2R and losses of 1R (R is the amount risked on a trade), 1% of the balance risked per trade and two trades a day. Then it counts how many of those futures reach the target, how many fall by half along the way and how many lose 90% of the account.
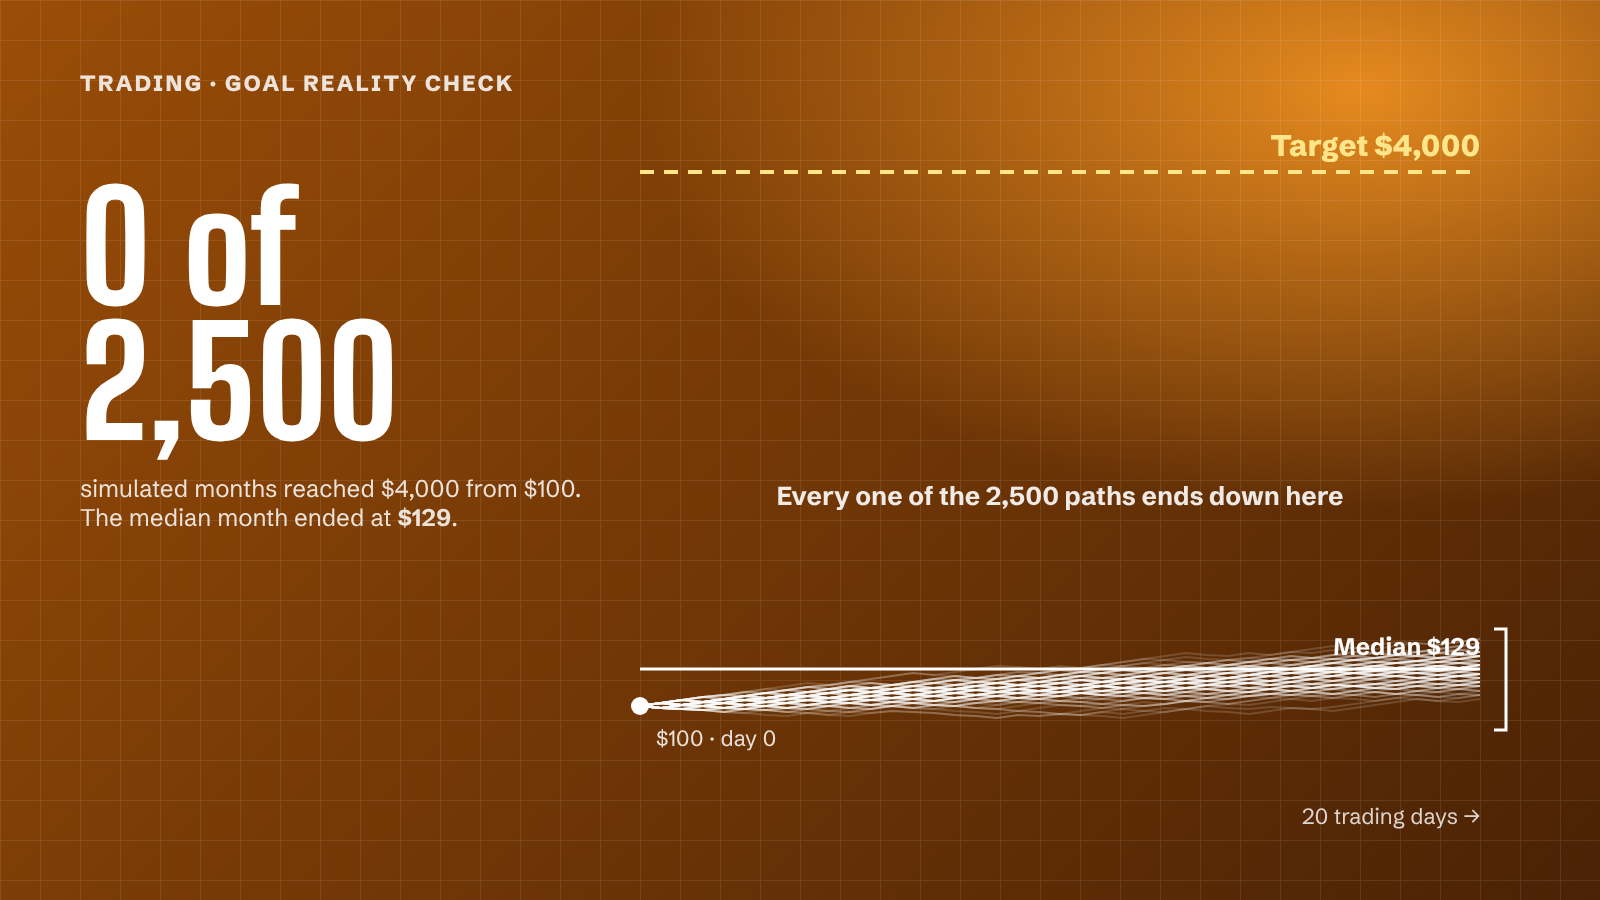
For $100 to $4,000 in 20 days at 1% risk, none of the 2,500 paths reached the target. The median ending balance was $129. That is a good month (+29%), and still about $3,870 short of the goal.
The only way to make the target reachable is to risk far more per trade, and then the same simulation shows the other side: the chance of losing half or nearly all of the account climbs fast. The journal labels this goal “unrealistic, high ruin risk” and says so plainly before a single trade is placed.
For $10,000 to $11,500 in 60 days, at the same 1% risk and a 56% win rate, every simulated path reached the target, and none came close to losing half the account. That goal is labelled “achievable with discipline”, and the result rests on a stated assumption: that the trader really has that win rate and payoff.
What the simulation leaves out
The model is simple on purpose, and its limits matter:
- Trades are treated as independent. Real traders have streaks, and after a loss many risk more or trade more. The journal’s tilt detector is built for that: on a 240-trade sample journal it flagged 19 trades taken on tilt (revenge trades, widened stop-losses, bursts of overtrading), which cost 19.6R in total.
- The win rate and payoff are inputs, not facts. If they come from 15 trades, they mean very little. The journal’s edge analysis will not even start until there are at least 100 closed trades.
- Costs, slippage and broker rules are not in this check. The position-size calculator and prop-firm rule checks handle those separately.
So the simulation does not predict what will happen. It shows whether a goal is even reachable at a sane level of risk, which is exactly the question the “$100 to $4,000” goal never asks.
Why I built it this way
Most trading tools are excited about your goals. I wanted one that tells you the arithmetic first, because for most people the dangerous part of trading is not the strategy but the size of the bet chosen to hit an impossible number. The goal check, the risk calculator and the tilt detector are all in Lolo’s Ledger; the case study on this site explains the rest of the product.